Excel SpreadsheetPrevious versions of this website offered a Downloadable Excel Spreadsheet. It generated a lot of questions about tax situations that we personally do not face every year. We are not tax accountants, so we can't answer any of those questions, therefore, we are discontinuing the link to our very old 2019 spreadsheet. We are leaving the detailed description of the 2019 spreadsheet at the bottom of this page, but again, it describes the 2019 brackets and laws, not the 2023 brackets and laws. But, before we do that, let's talk about the purpose of the spreadsheet.  The entire concept of the spreadsheet was to allow individuals to calculate and visually see their current annual retirement income and projected retirement income each year as it relates to each individual's personal "Sweet Spot". How close is and will be your projected income to the point where you cross into the Federal 22% tax bracket (your 40.7% Marginal Tax Bracket), and / or how close are you to your Long Term Capital Gains becoming taxable income at 12% plus 15% (your 49.95% Marginal Tax Bracket). 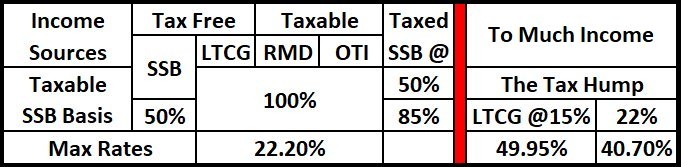 Using the 2023 tax brackets, depending on the size of your personal Social Security Benefits, a single individual could have a gross income of $60,000, $70,000 or $80,000 and pay only $4,807 in Federal taxes, somewhere between 6% and 8%. And their tax rate could be even lower if some of that income was from Long Term Capital Gains! BUT, if you do not control your taxable income, your next dollar of income could be taxed at 49.95%. Throw in State, Local, and Sales taxes, and you could literally have to earn more than $300 at a part time job to pay the government more than $200 in taxes, so you can buy a $100 Christmas gift for your grandchild! That is an overall tax rate over 67%!
As we just said, we are not tax accountants, we have no idea how to handle the taxes on:
The only thing that is important is the proper calculation of your taxable income, and what tax bracket you are in. We need some type of application where each retired (or planning to retire) individual can estimate and track their projected annual income sources, perform an estimated tax return, and then replay and display were that individual's taxable income is as it relates to their personal sweet spots. Then we need some reasonable investment advisors / fiduciaries to make the proper recommendations on how to prepare for each individual's retirement lifestyle as it relates to Roth IRAs, Home Equity Lines of Credit, Reverse Mortgages, Annuities, etc., etc., etc. This website was only designed to let individuals know and hopefully understand some of the extremely high Marginal Tax rates that they could be facing during their retirement. Disclaimer 1: The Federal Tax Laws and Regulations are over 10 million words in length, and that number does not include the laws and regulations created by each of our 50 States, over 3,000 Counties, and who knows how many Cities and Townships! The spreadsheet included with this website is extremely simplified and only covers the Federal Taxes. It is only designed to give you a perspective of the Marginal Tax Rates that you might face during your retirement and to provide you with some ideas on things you might do to avoid those extreme rates. You can use it at your own risk, but we highly recommend that you double check the results with other sources. Disclaimer 2: And the tax laws are constantly changing. A few years ago the normal rates were 10%, 15%, and 25% with Tax Hump rates of 46.25% and 55.5% after the 27.75% Sweet Spot. Then the rates were changed to 10%, 12% and 22% which lowered the Tax Hump rates to 40.7% and 49.95% after the 22.2% Sweet Spot. My advice back then was that doing a Roth Conversion at 25% was better than paying 27.75% during retirement. The 25% conversions I did 3 years ago were profitable compared to the 27.75% Sweet Spot that existed at that time, but are now a small loss compared to the 22.2% Sweet Spot that exists today. That is OK with me because it also means that the RMDs that I have to withdraw each year are smaller and I have more tax free income available. The 2019 spreadsheetThe spreadsheet that was originally attached to this website was designed to give you a vivid picture of Your Personal Marginal Tax Rates and the Personal Tax Hump that they create. It consisted of four tabs:
This is what the 2019 spreadsheet looked like!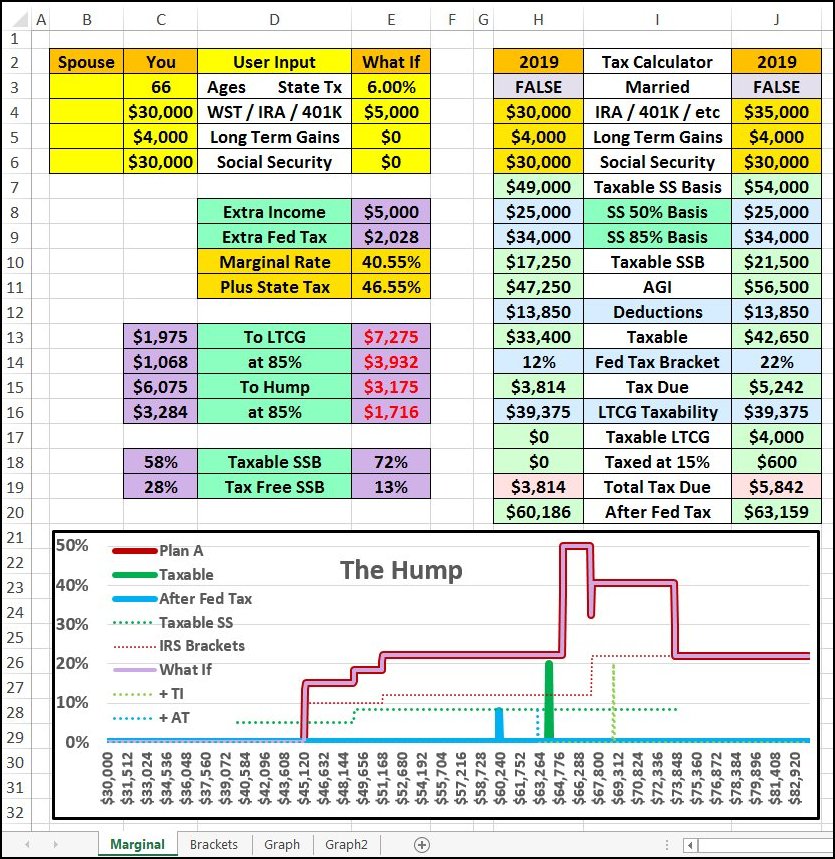
It is important to note that the To Hump and To LTCG numbers represent the available increase in your "Taxable Income". Just remember that while you are in the 85% taxability bracket for your Social Security Benefits, each additional dollar of actual income increases your taxable income by $1.85. The amount of additional income / IRA or 401k withdrawals is the second number in each case, the at 85% number! A picture is worth a thousand words!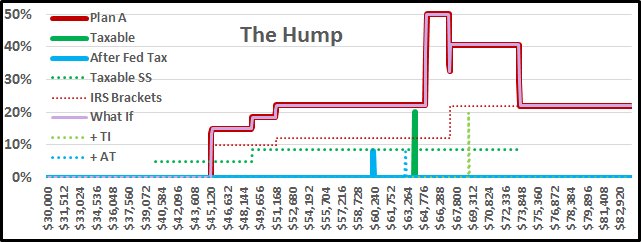 But in this case it could be worth thousands of dollars! The extra income frames indicated that the extra $5,000 would cost $2,028 in extra Federal taxes. If this extra cash had been withdrawn or converted before retirement at the 22% Federal tax bracket, the Federal tax would have only been $1,100, a $928 savings if you were aware of the future interaction of your desired standard of living and your personal tax hump. Your Tax Hump did not change in this example because the What If data only included $5,000 of extra taxable income, so the solid purple marginal bracket line is directly over the solid red line. The dotted red line illustrates your Federal Tax Brackets while the dotted green line illustrates the 50% and 85% parallel taxation of your Social Security benefits for the combined Spouse and You data. The important data is represented by the tic marks. The solid green tick mark illustrates the gross income data that you entered in the Spouse and You columns. Note its relationship to the solid red marginal tax line, you are very close to your personal Tax Hump. Also note the distance between the solid green gross income tick and the solid blue After Fed Tax tick. What If your situation at the end of the tax year was a little different? 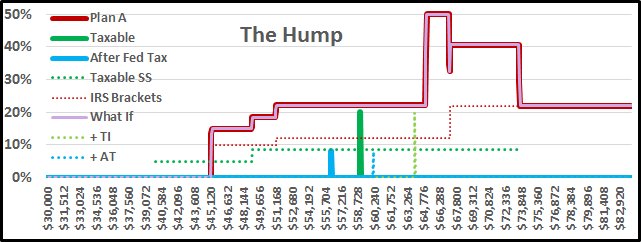 If you take the extra $5,000 out of your IRA in December, you could take that much less out in January! Next year, if all goes as normal, you would be able to do the same for an extra $10,000, or, if an unexpected expense happened during that year, you could have covered it without paying any of your huge Hump Taxes! As with everything else on this website, verify your estimated taxes with and without the extra income from other sources. |
||||||||||||||||||||||||||||||||||||||||||||||
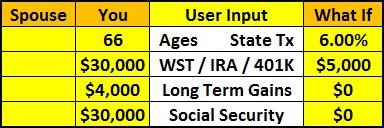 You entered your personal information in the yellow User Input
frames at the top left of the Marginal tab.
You entered your personal information in the yellow User Input
frames at the top left of the Marginal tab.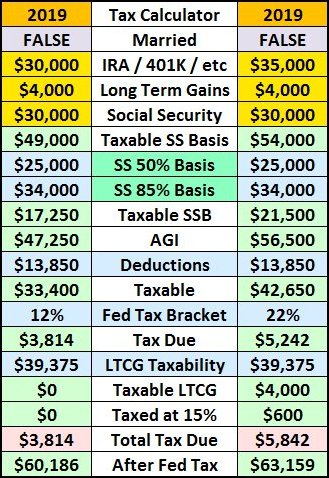 The Tax Calculator was the primary purpose of this spreadsheet.
It used the 2019 Tax Brackets and the personal information that you entered
in the User Input frames to calculate the taxes you will owe based
on data you entered for You and your Spouse in the first
tax calculator column plus the data you enter in the What If column
in the last tax calculator column.
This data is then used to give you the following information:
The Tax Calculator was the primary purpose of this spreadsheet.
It used the 2019 Tax Brackets and the personal information that you entered
in the User Input frames to calculate the taxes you will owe based
on data you entered for You and your Spouse in the first
tax calculator column plus the data you enter in the What If column
in the last tax calculator column.
This data is then used to give you the following information: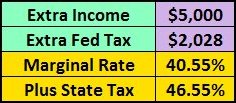 The Extra Income frames below your User Input will
detect the increase in your taxes from the Tax Calculator, compare
it to the amount of extra income you are looking at in the What If
column and calculate your Federal Marginal Tax Rate and
your total marginal rate including your personal state and local tax rates.
The Extra Income frames below your User Input will
detect the increase in your taxes from the Tax Calculator, compare
it to the amount of extra income you are looking at in the What If
column and calculate your Federal Marginal Tax Rate and
your total marginal rate including your personal state and local tax rates.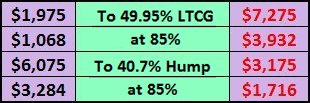 The To LTCG and To Hump frames let you know how much
additional income you can afford before entering your personal tax hump. This
information is supplied for both your now and What If situations. Red numbers are
negative and let you know how far your income is into the hump, how much you have to
cut back to avoid the hump!
The To LTCG and To Hump frames let you know how much
additional income you can afford before entering your personal tax hump. This
information is supplied for both your now and What If situations. Red numbers are
negative and let you know how far your income is into the hump, how much you have to
cut back to avoid the hump!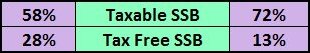 You are also given the information on how much of
your Tax Delayed Social Security has been taxed and how much is still tax free
income!
You are also given the information on how much of
your Tax Delayed Social Security has been taxed and how much is still tax free
income!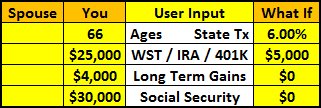 You enjoyed a comfortable year on a $59,000 gross
income, paying only $2,704 in Federal taxes.
You enjoyed a comfortable year on a $59,000 gross
income, paying only $2,704 in Federal taxes.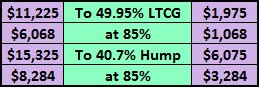 Looking at your solid green tick mark,
and the To LTCG (at 85%) data, you can take additional taxable income out of your IRA
at the 22.2% marginal tax rate this year which could help you to avoid the 40.7%
marginal tax hump next year!
Looking at your solid green tick mark,
and the To LTCG (at 85%) data, you can take additional taxable income out of your IRA
at the 22.2% marginal tax rate this year which could help you to avoid the 40.7%
marginal tax hump next year!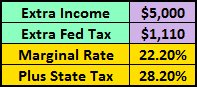 The spreadsheet says that you can take about $6,000
out of your IRA, but you decide to play it safe and take out only $5,000 and the
spreadsheet indicates that you will only pay 22.2% in Federal taxes.
The spreadsheet says that you can take about $6,000
out of your IRA, but you decide to play it safe and take out only $5,000 and the
spreadsheet indicates that you will only pay 22.2% in Federal taxes.