Your Personal Tax Brackets!Click on the following Radio Buttons to see how your Personal Tax Brackets are changed based on the tax year, your marital status, your Social Security benefit level, your retirement age and if you also have Long Term Capital Gain income. In an attempt to illustrate how the inflation rates over the past two years have effected your retirement lifestyle: The selected SS Benefit levels are for 2020, they are COLA (inflation) adjusted by 1.3% for 2021, plus by 5.9% for 2022, then again by 8.7% for 2023. 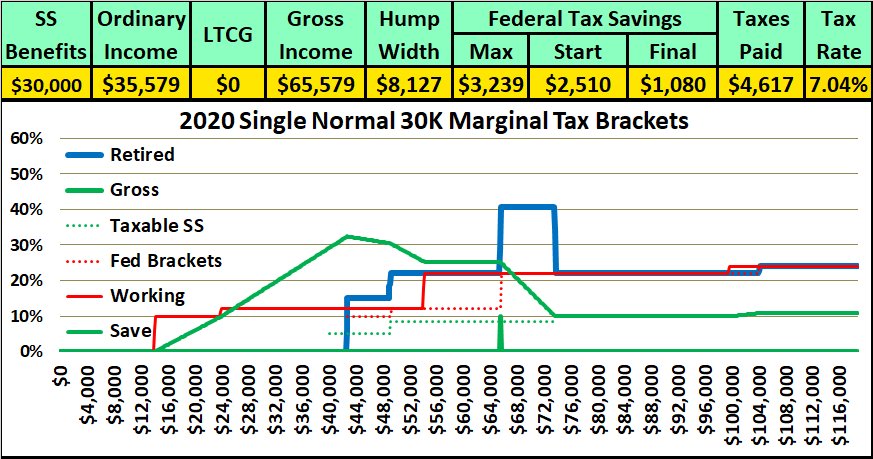
Retired Gross Taxable SS Fed Brackets Working Save Note how the rates shift to the left when you click the Married radio button. The “marriage penalty” was removed from our tax brackets in 2002, but not from the taxability of our Social Security benefits established in 1983 and 1993. Single Individuals start paying taxes on their benefits at the $25,000 “basis” level. Domestic Partners would start at a combined $50,000 level, but a Married Couple starts paying taxes on their benefits at $32,000, hence the shift in the Taxable SS and marginal tax rate lines!
So let's compare the Save lines, excluding LTCGs, on each of these images for 2020 vs 2023 and Married vs Single! 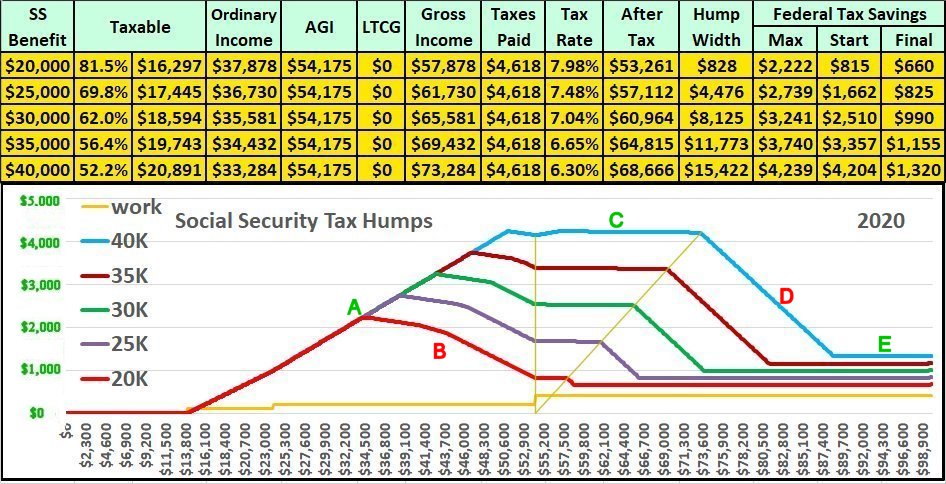
Each of these images is broken up into 5 segments:
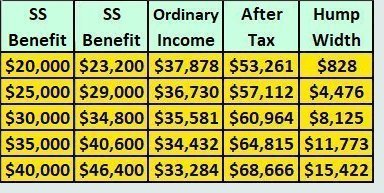
But these are the columns above the graph that are far more important while planning for and living in your retirement years. The first two columns illustrate how the huge COLA adjustments in 2021, 2022 and 2023 effected the size of your Social Security benefits. The next column is interesting, as your Social Security increases, the amount of additional income that you can have before crossing into your Personal Tax Hump actually decreases. The next column is how much you will have after Federal Tax. This is what will determine your retirement lifestyle. Also, since your other income was lower for higher benefit levels, higher benefits pay lower State and Local Taxes. The Hump Width is also very important, the larger your benefit, the larger the size of your Personal Tax Hump, which is why it is far more important to plan your income sources when you are getting larger benefits. This is why it is extremely important that you start doing your taxes in January each year. Everyone else starts doing the previous year's taxes in January of the next year. You have to start doing the current year’s taxes each January. You need to determine how much additional "Ordinary Income" you can have during the current year before entering your Personal Marginal Tax Hump. And, you need to make the proper plans for where any extra money will come from if you need it. Did you create a Roth IRA account? Do you have a Home Equity Line of Credit?  We've seen the effect of Marginal Tax Brackets on Social Security Benefits in $5,000 increments, now let’s take a look at how your personal benefit level is determined. Next - How your personal SS benefits are calculated! |
|||||||||||||||||||||||||||||||||||||||||||||